
Opportunistic credit investing
Opportunistic credit, like other alternative investments, offers the chance to pursue potentially higher long-term returns and greater diversification than may be available through traditional investment products.
Originally published on June 2024 by our U.S. partners.
Highlights
- What is opportunistic credit?
- Broad credit distress has displayed a cyclical pattern
- Looking back at past dislocations
- Distress/default is ever present in high yield bonds
- Looking ahead
- Opportunistic credit investing and diversification
Broad credit distress has displayed a cyclical pattern
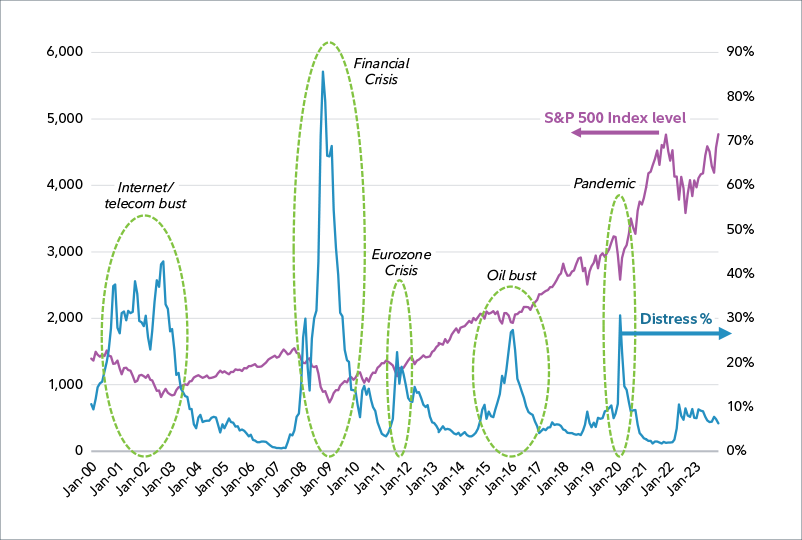
The chart below shows the long-term total return of the S&P 500 and the time series of the share of distress in the US high yield bond market. The share of the US high yield bond market qualifying as distressed (>1000 bps yield spread) is in blue on the right axis, with the level of the S&P 500 in purple on the left axis.
Note the directionally inverse relationship between equity returns and high yield distress; as stock performance declines, the share of distress in the market tends to rise and vice versa. Each of five specific events highlighted below have unique underlying causes, yet the directional relationship is consistent.
The higher leverage of constituent companies and generally lower liquidity in the over-the-counter high yield market can lead to sharp increases in the amount of debt that rises to the level of distress during cyclical events. These regularly occurring events can present opportunities to invest in the debt of companies at depressed prices.