

Capital Market Assumptions: A Comprehensive Global Approach for the Next 20 Years
Asset returns in general over the next 20 years are expected to be lower than long-term averages, with stocks likely to outperform bonds and emerging markets likely to boast the highest returns.
Highlights
- Our long-term capital market assumption for U.S. equities is below long-term average returns due to lower growth potential and higher starting valuations.
- Emerging-market stocks represent the most attractive area for public market return expectations due to favorable growth prospects and better starting valuations.
- Fixed income return expectations are higher than last year due to higher starting bond yields.
- Higher-than-expected inflation would likely hurt most equity and fixed income returns, with long-duration nominal fixed income facing the most risk from higher inflation.
- If productivity growth were to surprise to the upside, we would expect stock and bond returns to be higher than our baseline expectations, with stocks likely benefiting the most.
Expectations based on our 2023 capital market assumptions1
U.S. Equities
- For U.S. stocks, we expect a 3.9% annualized real return through 2042, nearly half the 7.3% average since 2003 and far below the 7.1% advance since 1926. Our 20-year real return estimate increased from 3.0% in 2022. Risk-adjusted return estimates remain lower than their historical norms.
- Valuations for U.S. stocks remain elevated compared with the rest of the world. We believe they will converge closer to those of other developed markets over time.
- However, if productivity growth were to pick up, stocks would benefit from higher earnings and a stronger valuation backdrop.
U.S. Bonds
- We expect bond markets to produce a real return of 2.1% annualized over the next 20 years, vs. 2.0% a year historically (since 1926). This estimate rose from 1.9% in 2022, largely influenced by higher yields that increased the attractiveness of new bond investments.
- One meaningful risk is that higher-than-expected inflation over the next two decades could reduce the returns of long-duration nominal fixed-income assets, such as 30-year Treasury bonds.
Emerging Markets
- Emerging equities may represent the most promising area in the public markets, due to our expectations for higher real GDP growth and low starting valuations.
- We anticipate a 5.4% real return for emerging markets in the next 20 years, compared with a 6.4% real return over the past two decades.
Developed Markets (ex-U.S.)
- We expect most non-U.S developed countries, including Japan and several in Western Europe, to lag the real GDP growth of the U.S. through 2042, mainly due to weaker demographics. This is expected to keep earnings growth subdued relative to the U.S. and emerging markets.
- Return estimates for developed-equity markets outside the U.S. are 3.4% in real terms over the next 20 years, lagging U.S. stocks. We expect a diminished return for developed non-U.S. markets versus the long-term historical average, and slightly higher volatility compared with the U.S., based on a higher concentration of more-cyclical sectors. Also, we expect the dollar to weaken over the next 20 years, supporting the returns of non-U.S. assets.
U.S. Bonds vs. U.S. Stocks
- We expect the lower return environment will result in less attractive risk-adjusted returns for global equities compared with the historical average, with Sharpe ratios remaining relatively even across core stock and bond categories (Exhibit 2 in PDF).
- Our forecasts estimate a 1.8% gap between the real returns of U.S. equities and U.S. investment-grade bonds. Our estimate is currently in the 16th percentile relative to history, higher than last year but significantly lower than the previous two decades (Exhibit 3).
EXHIBIT 3: Over the next 20 years, we expect U.S. equities to outperform bonds by a smaller margin than they did during the past 20 years.
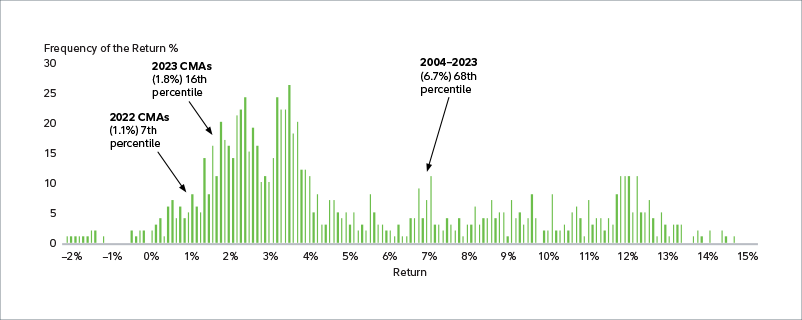
Past performance is no guarantee of future results. U.S. Equities - Dow Jones U.S. Total Stock Market Index; Investment-Grade Bonds-Bloomberg U.S. Aggregate Bond Index. Source: Fidelity Investments (AART), as of 4/30/23.