The case for owning small cap stocks
Why a combination of valuation and improved earnings have changed the outlook for this differentiated asset class.
Written by Forrest St. Clair and Benjamin Treacy. Originally published in April 2026.
Highlights
- Since 1929, the performance of large cap U.S. stocks versus small caps has run in cycles lasting about seven years, on average, making the current cycle of U.S. large cap outperformance an outlier.
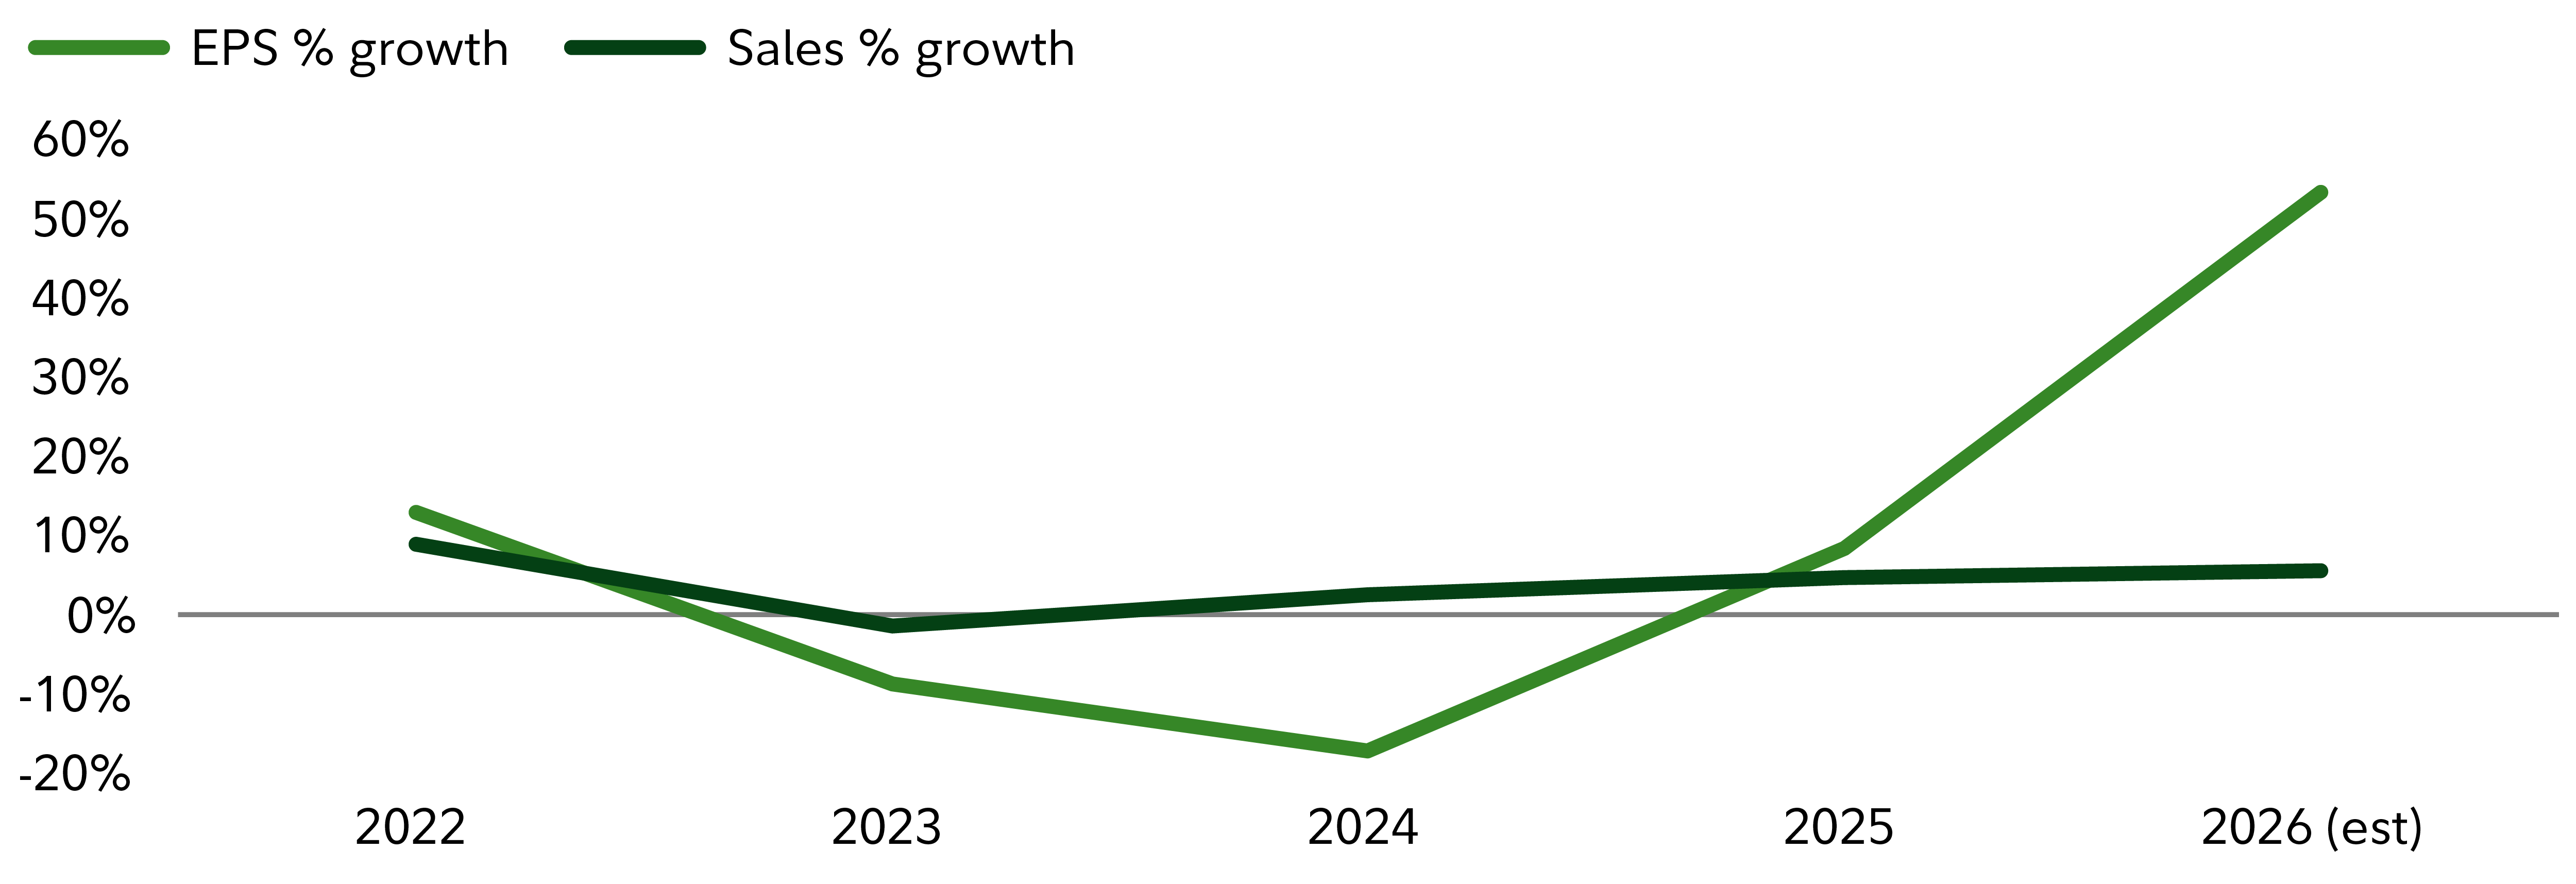
- What’s changed for small caps vs. recent years includes expectations for improved sales and better earnings.
- Meanwhile, relative valuations (U.S. small caps vs. large caps) are in their cheapest quintile since 1990, which has increased the historical odds of small caps outperforming large caps over the next 5 to 10 years.