
Between fragmentation and the AI revolution: Investing in a rewired world
Fidelity International’s Capital Market Assumptions (CMAs) provide return, volatility and correlation forecasts for various asset classes, typically over a strategic ten-year investment horizon. They are calculated using a proprietary model which employs quantitative econometric analysis and incorporates a diverse range of inputs, including bottom-up and top-down insights from across Fidelity’s global investment platform. This provides a robust foundation for Fidelity’s strategic asset allocation processes, which play a key role in investment solution design and portfolio construction.
Highlights
- AI: We have developed a holistic framework that combines Fidelity’s top-down macro scenario thinking with bottom-up analyst insights, captured regularly through our Analyst Survey. The weighted findings form our base case: somewhat higher long-term GDP growth. This is the first step in an ongoing process - we will evolve the framework as more data becomes available, focusing on labour impacts, investment dynamics, geopolitics and energy resilience.
- Macroeconomics: The effects of geopolitical fragmentation, elevated debt levels, and technological/energy transitions, will keep macroeconomic volatility above its average pre-Covid era level. Inflationary pressures will also remain elevated.
- Equities: Equities remain the key strategic portfolio growth drivers. Expected returns have increased, largely due to the positive effect of AI through the GDP channel. Prevailing margin levels are above our forward-looking estimates across many regions, but the equilibrium level of corporate profit margins has shifted structurally higher, reflecting a more profitable and innovation-driven environment. We will continue to monitor our forecasts in this area closely as the AI revolution could create both tailwinds and headwinds for profitability (e.g. labour productivity gains and policy responses like taxation).
- Fixed income: Bonds remain attractive thanks to higher government yield curves, but bond market volatility and equity-bond correlations will remain elevated. Expected credit returns are appealing, but tight spreads make risk/return trade-offs key. Short-term bonds are attractive shock absorbers and sovereigns should still diversify during recessionary shocks, although the latter may be less reliable during inflationary shocks.
- European real estate: The investment case is now increasingly income-led rather than reliant on significant yield compression since long-term interest rates look set to remain elevated.
- Foreign exchange: The US dollar may not provide the same return tailwinds or safe-haven characteristics as it has in recent decades.
- Portfolio construction: These dynamics call for a thoughtful active investment approach that incorporates greater regional/sectorial diversification and utilises a broader toolkit that includes tactical overlays, credit spectrum diversification, and differentiated sources of risk premia like absolute return or derivative strategies.
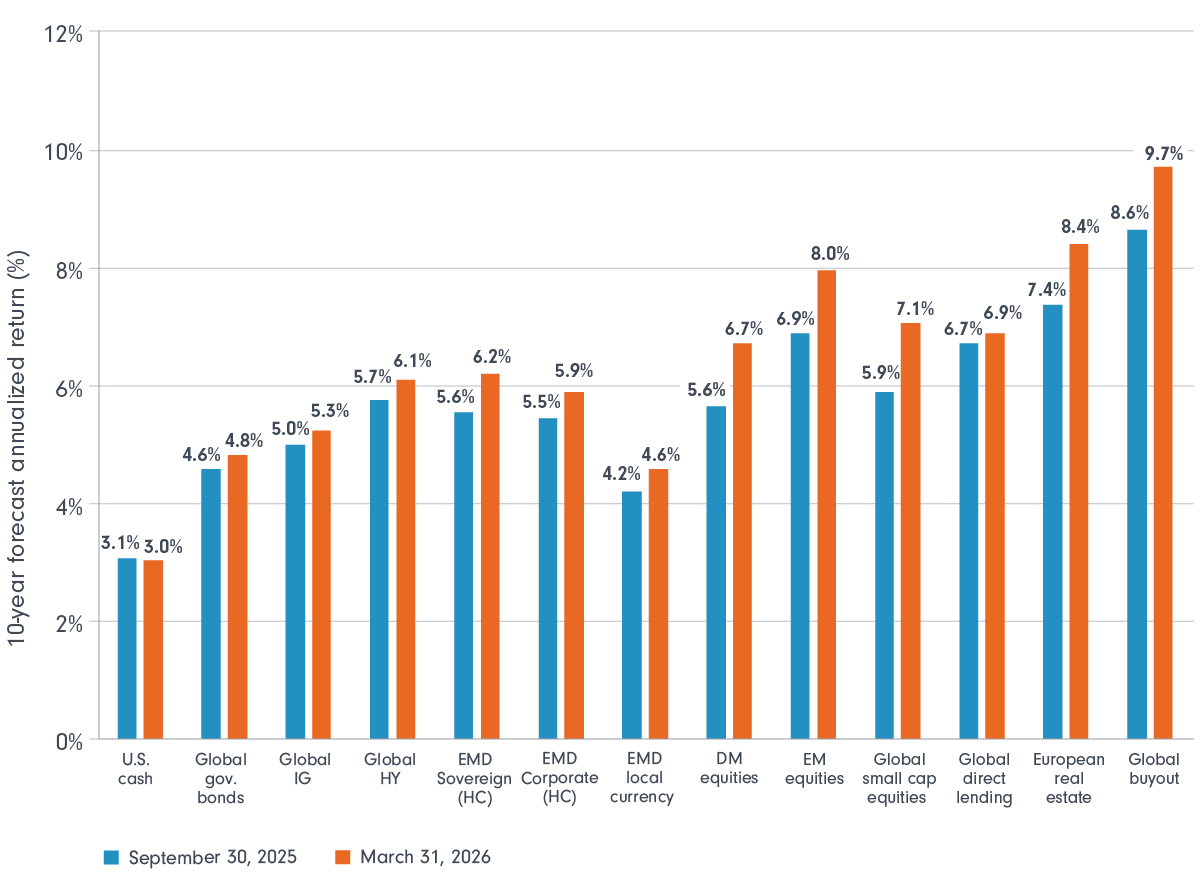
Source: Fidelity International, 31 March 2026. IG: investment grade; HY: high yield; EMD: emerging market debt; DM: developed market; EM: emerging market.